R을 활용한 GIS 데이터 시각화 | Yoon's Lab Note

R을 활용한 GIS 데이터 시각화

Preview


이번 포스팅에서는 오픈소스 라이브러리인 ‘leaflet’을 정리해보는 시간을 갖겠습니다. leaflet 라이브러리를 활용하면 간단한 코드로 반응형 지도를 만들 수 있고, 또한 분석 초점에 맞게 직접 템플릿을 만들어 적용해볼 수 있습니다.
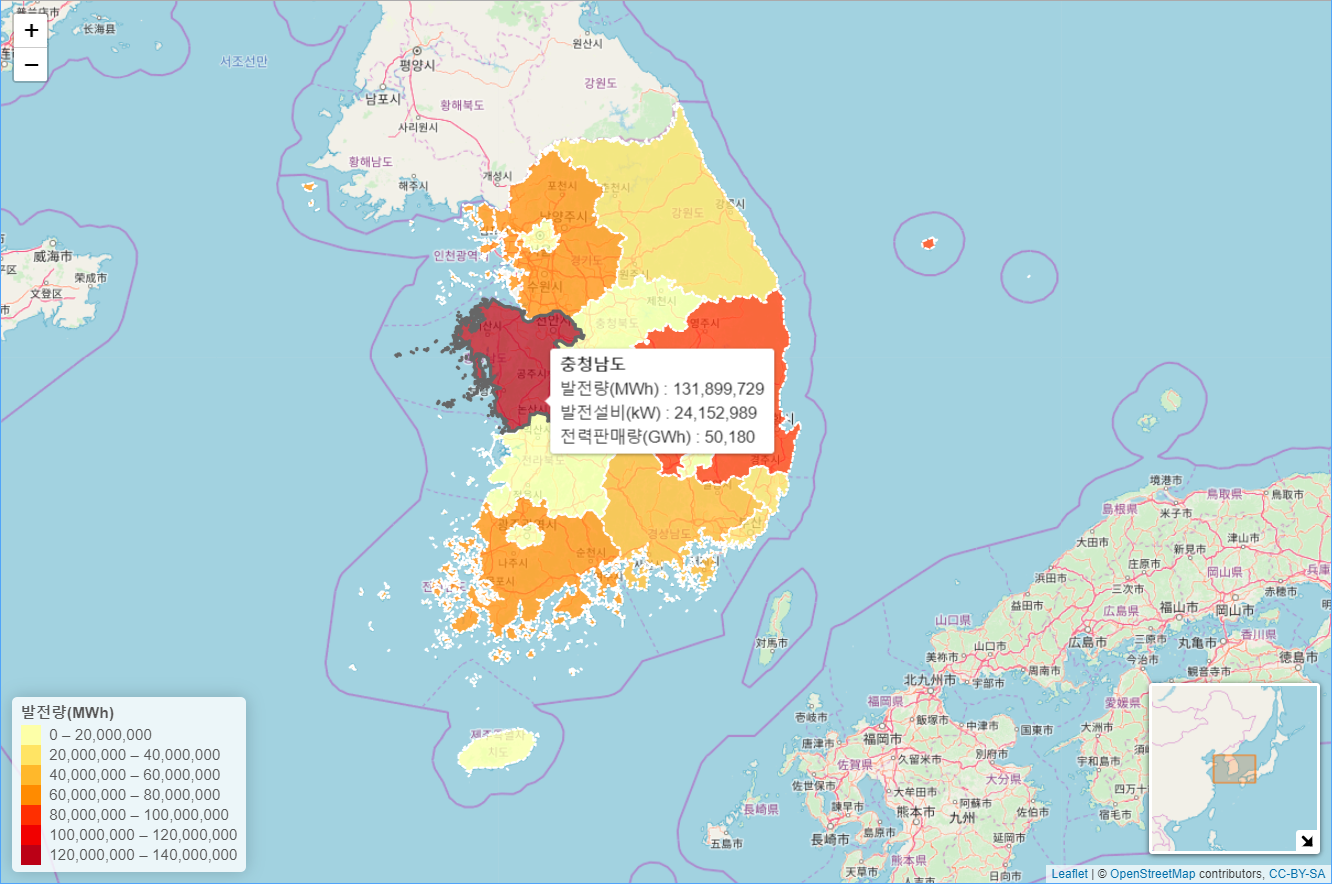

Load Library

1
2
3
4
5
6
7
library(rgdal)       # SHP파일을 위한 라이브러리
library(raster)      # SHP파일을 위한 라이브러리
library(dplyr)       # 데이터핸들링을 위한 라이브러리
library(data.table)  # 데이터핸들링을 위한 라이브러리
library(leaflet)     # 데이터를 지도 시각화
library(formattable) # comma truncate를 위한 라이브러리
library(htmlwidgets) # 결과를 HTML로 변환하는 라이브러리

Load Data

  • Source Code

1
2
3
4
5
6
7
8
shpData <- readOGR("./CTPRVN_201902/TL_SCCO_CTPRVN.shp")
shpData <- spTransform(shpData, CRS("+proj=longlat +ellps=GRS80"))

epData <- fread('2017년도 행정구역별 발전량.csv')

shpData@data <- left_join(shpData@data, epData, by = c('CTP_KOR_NM' = '지역'))

glimpse(shpData, width = 130)
  • Result

1
2
3
4
5
6
7
8
9
10
11
12
13
14
15
16
17
18
19
20
21
22
23
24
25
26
27
28
29
30
31
> glimpse(shpData, width = 130)
Formal class 'SpatialPolygonsDataFrame' [package "sp"] with 5 slots
  ..@ data       :'data.frame':	17 obs. of  6 variables:
  .. ..$ CTPRVN_CD      : Factor w/ 17 levels "11","26","27",..: 10 9 16 15 5 3 6 2 1 8 ...
  .. ..$ CTP_ENG_NM     : Factor w/ 17 levels "Busan","Chungcheongbuk-do",..: 6 8 10 9 7 4 5 1 16 15 ...
  .. ..$ CTP_KOR_NM     : chr [1:17] "강원도" "경기도" "경상남도" "경상북도" ...
  .. ..$ 발전설비(kW)   : int [1:17] 7405102 18166613 9157908 14028723 212460 546239 156729 6570449 161839 565636 ...
  .. ..$ 발전량(MWh)    : int [1:17] 20877663 61848495 55565845 84097154 480426 2673615 184668 26550923 841569 3052432 ...
  .. ..$ 전력판매량(GWh): int [1:17] 16553 114848 34648 45456 8684 15386 9424 21007 46298 2919 ...
  ..@ polygons   :List of 17
  .. ..$ :Formal class 'Polygons' [package "sp"] with 5 slots
  .. ..$ :Formal class 'Polygons' [package "sp"] with 5 slots
  .. ..$ :Formal class 'Polygons' [package "sp"] with 5 slots
  .. ..$ :Formal class 'Polygons' [package "sp"] with 5 slots
  .. ..$ :Formal class 'Polygons' [package "sp"] with 5 slots
  .. ..$ :Formal class 'Polygons' [package "sp"] with 5 slots
  .. ..$ :Formal class 'Polygons' [package "sp"] with 5 slots
  .. ..$ :Formal class 'Polygons' [package "sp"] with 5 slots
  .. ..$ :Formal class 'Polygons' [package "sp"] with 5 slots
  .. ..$ :Formal class 'Polygons' [package "sp"] with 5 slots
  .. ..$ :Formal class 'Polygons' [package "sp"] with 5 slots
  .. ..$ :Formal class 'Polygons' [package "sp"] with 5 slots
  .. ..$ :Formal class 'Polygons' [package "sp"] with 5 slots
  .. ..$ :Formal class 'Polygons' [package "sp"] with 5 slots
  .. ..$ :Formal class 'Polygons' [package "sp"] with 5 slots
  .. ..$ :Formal class 'Polygons' [package "sp"] with 5 slots
  .. ..$ :Formal class 'Polygons' [package "sp"] with 5 slots
  ..@ plotOrder  : int [1:17] 4 1 13 3 2 14 16 17 15 12 ...
  ..@ bbox       : num [1:2, 1:2] 124.6 33.1 131.9 38.6
  .. ..- attr(*, "dimnames")=List of 2
  ..@ proj4string:Formal class 'CRS' [package "sp"] with 1 slot

Set Config Values

  • Source Code

1
2
3
4
5
6
7
8
qpal <- colorBin("YlOrRd", domain = shpData@data$`발전량(MWh)`, n = 5)

labels <- paste0(
  '<strong>', shpData@data$CTP_KOR_NM, '</strong><br/>',
  '발전량(MWh)     : ', comma(shpData@data$`발전량(MWh)`, format='d'), '<br/>',
  '발전설비(kW)    : ', comma(shpData@data$`발전설비(kW)`, format='d'), '<br/>',
  '전력판매량(GWh) : ', comma(shpData@data$`전력판매량(GWh)`, format='d')
) %>% lapply(htmltools::HTML)
  • Result

1
2
3
4
5
6
7
8
9
10
11
12
13
14
[[1]]
<strong>강원도</strong><br/>발전량(MWh)     : 20,877,663<br/>발전설비(kW)    : 7,405,102<br/>전력판매량(GWh) : 16,553

[[2]]
<strong>경기도</strong><br/>발전량(MWh)     : 61,848,495<br/>발전설비(kW)    : 18,166,613<br/>전력판매량(GWh) : 114,848

[[3]]
<strong>경상남도</strong><br/>발전량(MWh)     : 55,565,845<br/>발전설비(kW)    : 9,157,908<br/>전력판매량(GWh) : 34,648

[[4]]
<strong>경상북도</strong><br/>발전량(MWh)     : 84,097,154<br/>발전설비(kW)    : 14,028,723<br/>전력판매량(GWh) : 45,456

[[5]]
<strong>광주광역시</strong><br/>발전량(MWh)     : 480,426<br/>발전설비(kW)    : 212,460<br/>전력판매량(GWh) : 8,684

Data Visulization

  • Source Code

1
2
3
4
5
6
7
8
9
10
11
12
13
14
15
16
17
18
19
20
21
22
23
24
leaf <- leaflet(shpData) %>%
  addTiles() %>%
  addPolygons(
    fillColor = ~qpal(`발전량(MWh)`),
    weight = 2,
    opacity = 1,
    color = "white",
    dashArray = "3",
    fillOpacity = 0.7,
    highlight = highlightOptions(
      weight = 3,
      color = "#666",
      dashArray = "",
      fillOpacity = 0.7,
      bringToFront = TRUE),
    label = labels,
    labelOptions = labelOptions(
      style = list("font-weight" = "normal", padding = "3px 8px"),
      textsize = "15px",
      direction = "auto")) %>%
    addLegend(pal = qpal, values = ~`발전량(MWh)`, opacity = 1, position = "bottomleft") %>%
    addMiniMap(toggleDisplay = TRUE,
               position = "bottomright")
leaf
  • Result

Result


Result to HTML

1
saveWidget(leaf, 'leaflet.html', selfcontained = FALSE)
0%